
Kyle Broderick
When the Grass Isn’t Greener: Diagnosing Turf Diseases
Dennis Ferraro
Who's Living in my Grass? Turfgrass Wildlife Damage Prevention
Matt Sousek
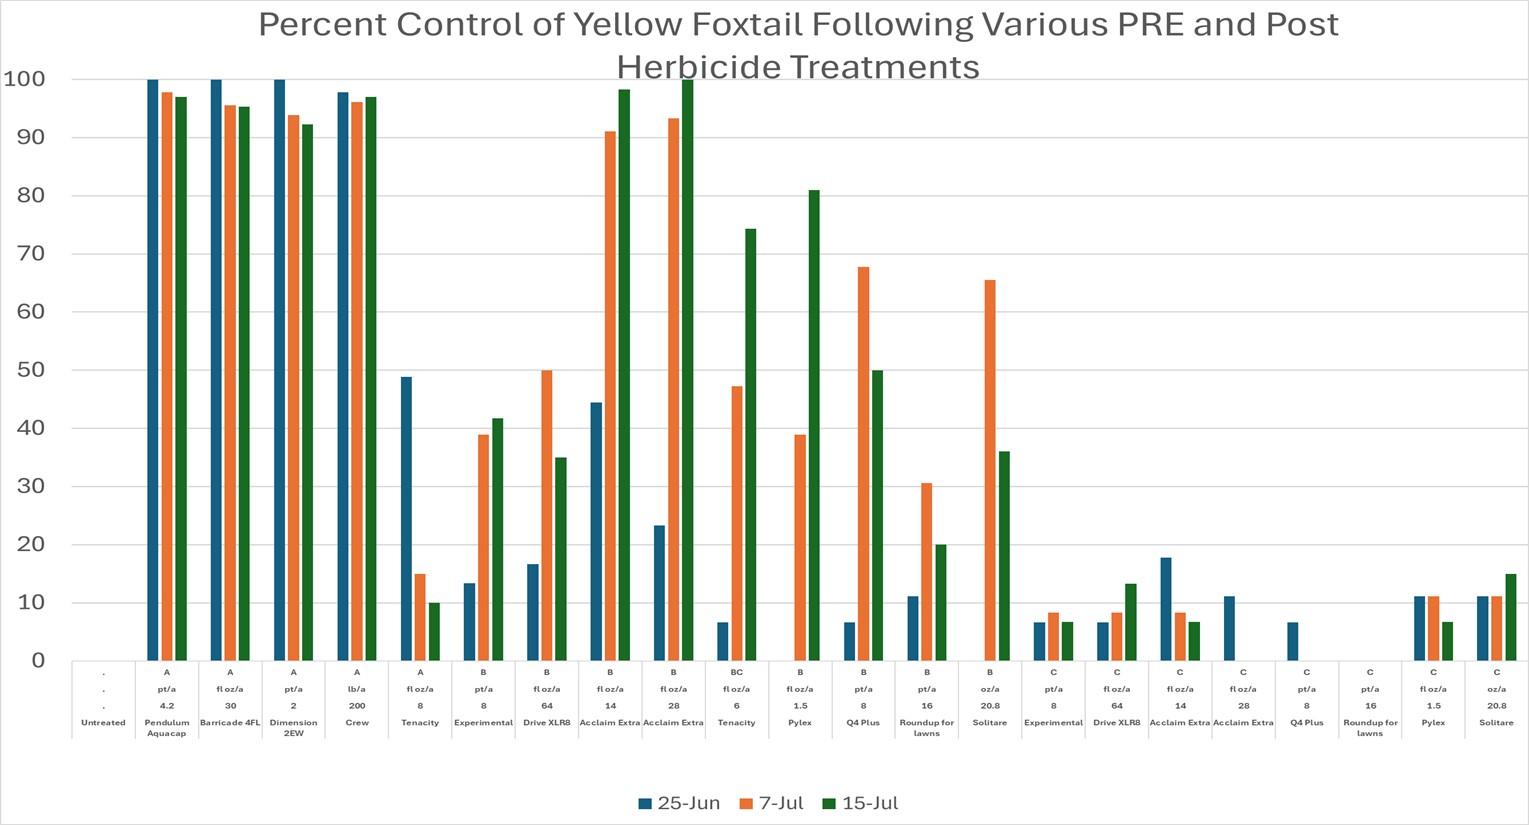
Herbicides Selection for Foxtail and Crabgrass Before and After Emergence
Yellow foxtail can be a difficult weed to control with post herbicides. This trial was designed to help determine the herbicides and timings of application that work the best. Applications were made on A=May 8th application, B= June 27th application, C= July 15th application and ratings were taken on June 25th, July 7th and July 15th.
Preliminary data results on figure 1, indicate that the high label rates of the 3 main preemergent herbicides and a newer granular called Crew applied on May 8th provide near 100% control to this point in the year. Post treatments that were applied at the 3-5 leaf stage of yellow foxtail resulted in variable control depending on the herbicide applied. Acclaim Extra at both the 14 and 28 oz rate resulted in the highest control at near 100% with Drive XLR8, Tenacity, Pylex, Q4 Plus, and Solitare, resulting in lower control at the July 15th rating ranging from 60-75%. The last application applied on July 15th will be evaluated for the remainder of the summer.
Like foxtail, the preemergent herbicides results on figure 2 applied on May 8th resulted in 100% control of crabgrass. Applications of Post herbicides on June 27th varied in control with Acclaim on top at 100% control for both rates and the next best treatments were Tenacity at 85%, Pylex 70%, Q4 plus, 60% Roundup for Lawns 53%, and Solitare 68% crabgrass control at the July 15th rating. The last application applied on July 15 will be further evaluated to determine if these herbicides are effective on more mature crabgrass.
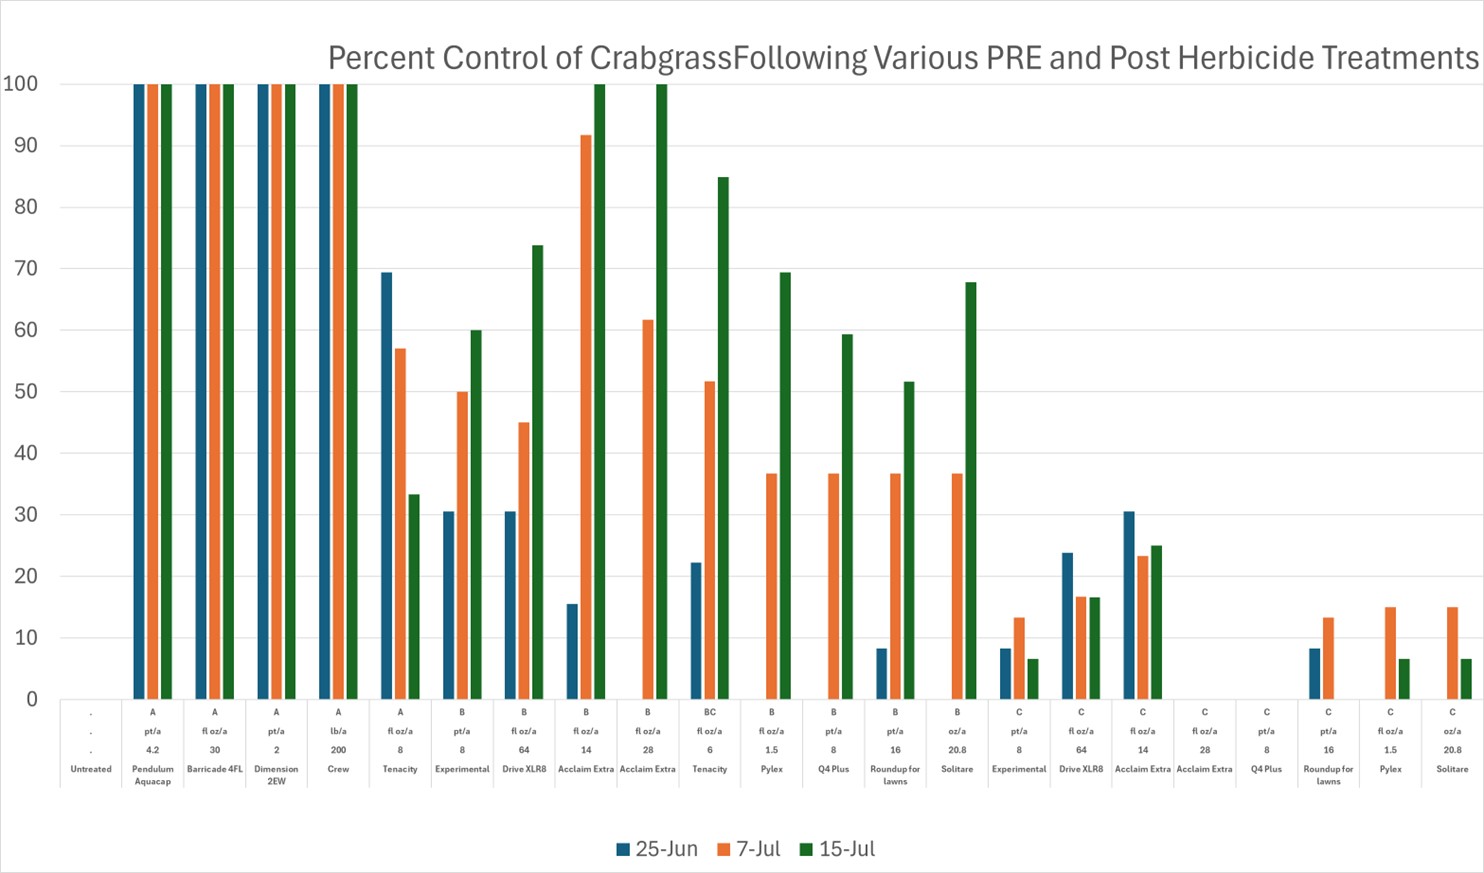
Table 1 below indicates the % cover of foxtail or crabgrass on the indicated rating dates. The lower the % cover the better the control. Application codes stand for A=May 8th application B= June 27th application C= July 15th application. Means followed by the same letter do not significantly differ.
| Rating Date | 6/25/2025 | 7/7/2025 | 7/15/2025 | 6/25/2025 | 7/7/2025 | 7/15/2025 | ||||
| Rating Type | % cover | % cover | % cover | % cover | % cover | % cover | ||||
| Pest Name | Foxtail | Foxtail | Foxtail | Crabgrass | Crabgrass | Crabgrass | ||||
| Data Entry Date | 7/21/2025 | 7/21/2025 | 7/21/2025 | 7/21/2025 | 7/21/2025 | 7/21/2025 | ||||
Trt | Treatment |
| Rate | Application | 1 | 2 | 3 | 4 | 5 | 6 |
No. | Name | Rate | Unit | Code |
|
|
|
|
|
|
1 | Untreated |
|
|
| 11.7 ab | 16.7 ab | 21.7 ab | 12 a-d | 15.7 a-d | 16 abc |
2 | Pendulum Aqua | 4.2 | pt/a | A | 0 e | 0.3 g | 0.7 g | 0 e | 0 g | 0 e |
3 | Barricade 4 FL | 30 | fl oz/a | A | 0 e | 0.7 fg | 1 g | 0 e | 0 g | 0 e |
4 | Dimension 2 EW | 2 | pt/a | A | 0 e | 1 fg | 1.7 fg | 0 e | 0 g | 0 e |
5 | Crew | 200 | lb/a | A | 0.3 e | 0.7 fg | 0.7 g | 0 e | 0 g | 0 e |
6 | Tenacity | 8 | fl oz/a | A | 5.7 d | 14 abc | 19.3 ab | 5 de | 5.7 efg | 8.3 cd |
7 | Experimental | 8 | pt/a | B | 10 a-d | 10 cde | 12.7 e | 13.3 a-d | 9 def | 3.3 de |
8 | Drive XLR8 | 64 | fl oz/a | B | 10 a-d | 8.3 de | 14 cde | 11.7 a-d | 8.3 def | 1.7 de |
9 | Acclaim Extra | 14 | fl oz/a | B | 6.7 cd | 1.3 fg | 0.3 g | 10 bcd | 2 fg | 0 e |
10 | Acclaim Extra | 28 | fl oz/a | B | 9.3 bcd | 1 fg | 0 g | 20 a | 5.3 efg | 0 e |
11 | Tenacity | 6 | fl oz/a | BC | 12.7 ab | 8.3 de | 5.3 f | 13.3 a-d | 5.3 efg | 1.3 de |
12 | Pylex | 1.5 | fl oz/a | B | 13.3 ab | 10 cde | 4.3 fg | 20 a | 10 def | 2.3 de |
13 | Q4 Plus | 8 | pt/a | B | 10.7 abc | 5.7 ef | 11 e | 18.3 ab | 10 def | 3.3 de |
14 | Roundup for Lawns | 16 | pt/a | B | 11.7 ab | 11.7 bcd | 17.3 bcd | 18.3 ab | 11.7 cde | 8.3 cd |
15 | Solitaire | 20.8 | oz/a | B | 11.7 ab | 5.3 efg | 13.3 de | 20 a | 10 def | 3 de |
16 | Experimental | 8 | pt/a | C | 10.7 abc | 15 abc | 20 ab | 18.3 ab | 20 ab | 20 ab |
17 | Drive XLR8 | 64 | fl oz/a | C | 11 abc | 16.7 ab | 18.3 bc | 9.3 cd | 13.3 b-e | 12.7 bc |
18 | Acclaim Extra | 14 | fl oz/a | C | 9.3 bcd | 15 abc | 20 ab | 8.3 cde | 11.7 cde | 11.7 c |
19 | Acclaim Extra | 28 | fl oz/a | C | 13.3 ab | 16.7 ab | 21.7 ab | 16.7 abc | 20 ab | 20 ab |
20 | Q4 Plus | 8 | pt/a | C | 14 a | 18.3 a | 23.3 a | 20 a | 21.7 a | 20 ab |
21 | Roundup for Lawns | 16 | pt/a | C | 13.3 ab | 16.7 ab | 21.7 ab | 20 a | 20 ab | 21.7 a |
22 | Pylex | 1.5 | fl oz/a | C | 13.3 ab | 15 abc | 20 ab | 18.3 ab | 18.3 abc | 20 ab |
23 | Solitaire | 20.8 | oz/a | C | 13.3 ab | 15 abc | 18.3 bc | 18.3 ab | 18.3 abc | 20 ab |
LSD P=0.5 | 4.6 | 5.11 | 4.44 | 8.75 | 8.25 | 8.26 | ||||
Treatment Prob(F) | 0.0001 | 0.0001 | 0.0001 | 0.0001 | 0.0001 | 0.0001 | ||||
Amanda Folck
Bermudagrass Traffic and Overseeding Effect in Nebraska
Year 1 data was completed last year from August to November, 2024, at the East Campus Turfgrass Research Center in Lincoln, NE. The tables below are organized on the lowest and highest rating averages of the Clegg and shear test from the lowest and highest result of Tahoma 31, Latitude 36, and Ironcutter bermudagrass. Information from ratings includes first overseeding rates from different timings (1= July 21, 2=August 5, 3=August 18 at research plots in white) that continue to mid-October 2024; traffic (T) or no traffic (NT) and type of seeding application (drop (DS) or slit seeder (SS)), types of overseeding (O/S) (SunRye perennial ryegrass (PRG), HGT Kentucky bluegrass (KBG), or no overseeding). Overall mean for 2024 result was 57.118 Gmax for Clegg and 14.502 N*M for shear test.
There are differences in overseeding rates, types and effect of traffic and non-traffic areas in results below in the various tables showing Tahoma 31 had the lowest and highest shear and highest Clegg. Ironcutter was lowest in Clegg result. Note: there was 89 traffic days for the 2024 data results.
| Name of BMG | Traffic (T) or Not Traffic (NT) | Rate O/S (lbs/A) | SS or DS | Date of First Overseeding (O/S) | O/S Type | Average (N*M) | |
| Lowest | Tahoma 31 | T | 10 | SS | August 5 | KBG | 10.000 |
Latitude 36 | T | 2 | SS | August 5 | PRG | 10.188 | |
Ironcutter | T | 5 | SS | August 5 | KBG | 10.667 | |
| Highest | Ironcutter | NT | 10 | DS | August 19 | PRG | 18.00 |
Latitude 36 | NT | 2 | DS | August 5 | KBG | 18.750 | |
Tahoma 31 | NT | 10 | DS | August 5 | PRG | 19.111 |
| Name of BMG | Traffic (T) or Not Traffic (NT) | Rate O/S (lbs/A) | SS or DS | Date of First Overseeding (O/S) | O/S Type | Average (Gmax) | |
Lowest | Ironcutter | T | 5 | DS | August 19 | KBG | 43.778 |
Latitude 36 | T | 5 | DS | August 19 | KBG | 47.111 | |
Tahoma 31 | T | 10 | SS | August 5 | PRG | 58.889 | |
Highest | Ironcutter | T | 5 | DS | August 5 | KBG | 66.333 |
Latitude 36 | T | 5 | DS | July 22 | KBG | 69.778 | |
Tahoma 31 | T | 5 | DS | July 22 | PRG | 77.889 |